
Cost Structure Analysis: How to Break Down Your Costs
A cost structure analysis sorts everything your business spends into fixed and variable costs, and into direct and indirect costs, then shows what share of the total each one takes and how each behaves when revenue moves. Done well, it tells you where margin leaks and which cost cuts are safe. The numbers are the easy part. The hard part is tying each cost back to how your business actually makes money, which is where we start at Raremind with our Money Map.
Raremindraremind.coFind the Costs Behind Lost MarginRaremind’s Money Map connects costs to how your business earns revenue, helping identify inefficiencies without pushing unnecessary technology.Visit
TL;DR
Cost structure is the mix of fixed and variable costs in your total spend. It decides how much profit changes when sales rise or fall.
Break costs down twice: by behavior (fixed, variable) and by assignment (direct, indirect). Then calculate each category’s share of total cost.
Use a full, normal period of data, usually 12 months, so seasonal swings do not distort the picture.
Cut waste, not capability. Cost cuts that damage quality or delivery cost more than they save.
The analysis pays off when each cost is linked to the revenue it supports, not just listed in a spreadsheet.
Table of Contents
What cost structure means and why it matters
Step 1: Define scope and collect the data
Step 2: Break costs down by behavior and by assignment
Step 3: Calculate total cost and each category’s share
Step 4: Allocate overhead to what it supports
Step 5: Read the results
Step 6: Optimize costs without damaging the business
Common mistakes in a cost analysis
Where the spreadsheet stops and the Money Map starts
Perspective
What Raremind offers
Sources
What cost structure means and why it matters
Cost structure is the composition of fixed and variable costs within your total costs. Wall Street Prep notes that analyzing it helps you understand operating leverage: how changes in revenue flow through to operating income and profit margins.
Two plain definitions help here:
Fixed costs do not move with volume. Santa Clara University’s My Own Business Institute lists rent, salaries, insurance, loan repayments and some licenses.
Variable costs rise and fall with volume. The same source names materials, piece-rate labor, commissions, delivery, packaging and card fees.
The mix is a strategic choice, not just an accounting fact. MIT OpenCourseWare’s management accounting course describes cost structure as the relative level of fixed and variable costs, and says higher fixed costs generally produce lower variable cost per unit. A business with heavy fixed costs earns a lot on each extra sale once it covers them, and loses quickly when sales dip. A business with mostly variable costs is steadier but earns less on growth.
Stanford’s cost lesson adds that analyzing costs as a business scales matters because average costs may shrink as output grows, which creates room for higher profit. Cost structures also differ by industry, technology and quality level, so a figure only means something against your own model.
Step 1: Define scope and collect the data
Before you sort anything, decide what you are analyzing: the whole company, one product line, one location or one service. If you have never done this, start with one offering. Xero’s cost accounting guide recommends starting with a single offering and then comparing estimates with actual results monthly or quarterly.
Next, pick the period. Spending is rarely flat across the year. Cover a stretch long enough to capture normal monthly, seasonal and annual swings, and check that your sources are complete: general-ledger reports, balance sheet, income statement and cash-flow statement. Ramp’s guidance on spend analysis makes the same point about scope and period.
For each cost line, capture four things. The U.S. Department of Education’s cost analysis standards recommend recording the resource type, quantity, percentage of use and price for the analysis period, covering personnel, materials and equipment, facilities and other direct or indirect inputs. “Percentage of use” is the one owners skip. A software tool that two teams share, or a manager who splits time between two services, should not land entirely on one line.

Watch your accounting basis
When a cost appears depends on whether your books are on a cash or accrual basis. A comparison from the AICPA notes that U.S. tax accounting may use cash or accrual methods, and that businesses with inventories generally must use accrual treatment for inventory purchases and sales. If you buy inventory in March and sell it in June, a cash-basis view will make March look expensive and June look wonderful. Neither is true.
The analysis is only as good as the ledger underneath it. If categories are inconsistent or months are missing, tidy the books first. Small business bookkeeping services can help with the cleanup so cost visibility feeds pricing and cost-reduction decisions with confidence.
Step 2: Break costs down by behavior and by assignment
Xero lists four main cost categories: fixed, variable, direct and indirect. They overlap, so classify every line twice.
Direct costs can be assigned to a specific product, service, location or project, such as materials or the wages of the crew on a job.
Indirect costs support the whole business: management, accounting, the office, general software.
The Santa Clara University source organizes the work the same way: sort costs by fixed or variable behavior, then assign them to products, services or profit centers.
Here is how a small services firm with $1,000,000 in annual costs might lay out the grid. The figures are illustrative, not benchmarks.
Cost line | Annual cost | Behavior | Assignment |
|---|---|---|---|
Delivery staff salaries | $420,000 | Fixed | Direct |
Subcontractors | $180,000 | Variable | Direct |
Card and payment fees | $30,000 | Variable | Indirect |
Office rent and utilities | $120,000 | Fixed | Indirect |
Software subscriptions | $90,000 | Fixed | Indirect |
Marketing | $80,000 | Semi-variable | Indirect |
Admin and finance | $80,000 | Fixed | Indirect |
Semi-variable costs have a fixed base and a variable part, such as a phone plan with usage charges or a utility bill. Xero’s overhead guide asks you to separate fixed, variable and semi-variable overhead. Split these into their two parts instead of forcing them into one bucket.
Step 3: Calculate total cost and each category’s share
The math is short. Add fixed and variable costs to get total cost. Then, for each category, divide its cost by total cost and multiply by 100.
In the example above:
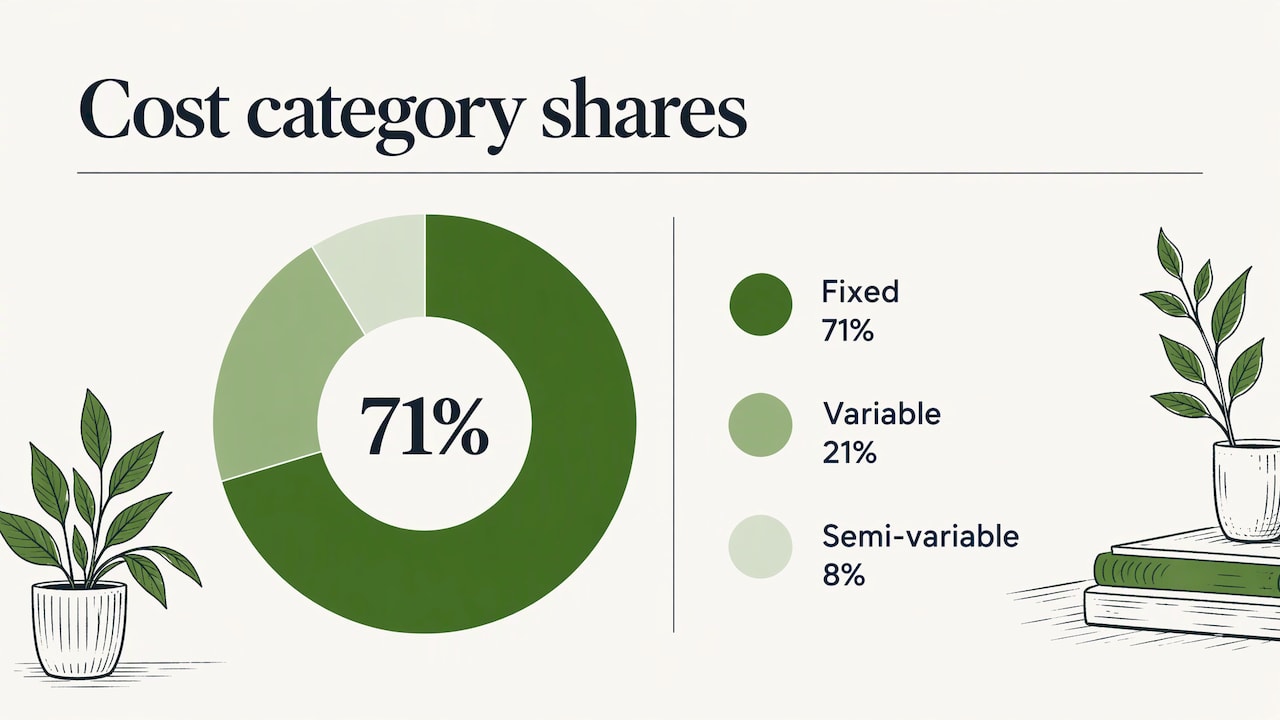
Fixed costs: $420,000 + $120,000 + $90,000 + $80,000 = $710,000, or 71% of total.
Variable costs: $180,000 + $30,000 = $210,000, or 21%.
Semi-variable (marketing): $80,000, or 8%, which you would split further.
A business that is 71% fixed is highly leveraged operationally. Every additional dollar of contribution after break-even falls largely to profit, and every shortfall bites hard. MIT’s course gives a way to measure this: degree of operating leverage is contribution margin divided by operating income, which expresses how sensitive operating income is to sales volume.
If you sell units, go one step further and calculate cost per sale. American Family Insurance suggests counting materials, labor, salaries, benefits and both fixed and variable overhead, then dividing total cost by total sales (unit price times units sold). If the result is close to or above 1.00, your pricing is not covering what it costs to serve.
Step 4: Allocate overhead to what it supports
Overhead is where most cost analyses go vague. Rent, insurance, administrative salaries, utilities, software, legal and professional fees and maintenance all belong here, per Xero’s overhead cost guide. The question is which products, customers or projects should carry them.
The standard method has five moves, laid out by Corporate Finance Institute in its cost allocation guide:
Identify the cost objects: the products, projects or departments you want to cost.
Accumulate indirect costs into pools, such as facilities or IT.
Choose an allocation base, for example labor hours, machine hours or direct costs.
Divide each pool by its base to get a rate.
Apply that rate to each cost object.
As a quick example, if your admin and facilities pool is $200,000 and your delivery team logs 10,000 billable hours, the overhead rate is $20 per hour. A job that takes 150 hours carries $3,000 of overhead.
Shared central services need the same treatment. The Washington State Auditor’s Office identifies IT, accounting, payroll, HR and facilities as common costs that need allocation across the units they serve. The logic carries over to a private company of any size.
The allocation base is a judgment, and it shapes your conclusions. Allocate by revenue and your biggest customers look expensive. Allocate by the hours of support each one uses and a small, demanding customer may turn out to be the unprofitable one. That question is the subject of our guide to cost to serve analysis.
Step 5: Read the results
With shares and rates in hand, ask five questions of each large line:
Which revenue does this cost produce? A cost with no revenue it can be tied to is the first candidate to question.
Is it fixed because it must be, or because nobody has revisited it? Renewals that roll over for years are common.
Does it overlap with another cost? Two tools, two vendors or two approval steps for the same outcome.
Does the cost grow faster than revenue? Compare each line’s share across periods.
Does pricing cover it? Costs that look reasonable in total can still be underpriced in one service line. Our piece on pricing strategy consulting covers that side.
Santa Clara University’s practical view is that tracking direct and indirect costs shows where money goes and where reduction efforts should focus, and that the same visibility supports pricing and prioritization.
Step 6: Optimize costs without damaging the business
The goal is a better cost structure, not a smaller one. SCORE’s profitability guide says cost reduction should eliminate waste and inefficiency without sacrificing customer satisfaction, product quality or safety.
The levers that survive that test, as listed by the Santa Clara University source, include:
Consolidating purchasing and encouraging vendors to compete for your business.
Asking for loyalty discounts from suppliers you plan to keep.
Converting fixed costs to variable where possible, which lowers risk if sales fall.
Considering outsourcing for work that is not core to what customers pay for.
Two more levers sit inside operations rather than in the supplier list. First, process cost: manual re-entry, rework and approval loops are paid for in salaries that the ledger files under “admin”. Second, tool cost: overlapping subscriptions pile up quietly. If that is your suspicion, see our guides on software license optimization and SaaS sprawl, and for a longer list of moves, 17 cost reduction strategies for small businesses.
Common mistakes in a cost analysis
Using one quarter of data. A seasonal business can look wildly profitable or unprofitable depending on the window. Ramp’s guidance warns that incomplete data or inconsistent periods make precise calculations directionally wrong.
Dumping everything into “overhead”. If half the spend sits in a single indirect bucket, you cannot see what drives it.
Cutting the cheapest line first. Small, easy cuts feel like progress, while the two or three largest lines hold most of the savings.
Ignoring time spent. Salaries are the biggest fixed cost in most service firms. Without percentage of use, you cannot tell which work they fund.
Treating the analysis as a one-off. Xero’s advice to compare estimates with actuals monthly or quarterly keeps the picture current.
Where the spreadsheet stops and the Money Map starts
A cost breakdown tells you what you spend. It does not tell you why that spending exists, and the why is where the savings and the margin sit. A line like “software, $90,000” becomes useful only when you can say which workflows it supports, which revenue those workflows produce, and which of them run twice.
That is the difference between cutting and fixing. Cutting a cost line leaves the workflow that created it. Fixing the workflow removes the cost and often improves delivery speed at the same time. It is also why the order matters: understand how the business earns money first, then judge each cost against it.
Perspective
Most cost reviews we see begin with the cost list and end with a cut list. We start somewhere else: how the business makes money, step by step, and where that path leaks.
That is what our Money Map is for. It lays out your current workflows next to the revenue they produce, so a cost is never just a number. It is a step in a process, and you can see whether the step earns its place.
We do not sell software and we take no vendor commissions. That means when a tool, a vendor or a process turns out to be redundant, we can say so without a conflict. Sometimes the answer is automation. Often it is a simpler process, or fewer tools doing the same job.
A cost structure analysis is worth doing once. It is worth much more when someone keeps the picture current as the business changes.
Mirko
What Raremind offers
Our Your Digital & AI Office plan is a flat monthly retainer at €995 per month. It provides ongoing strategic support: we analyze how your business generates revenue, map your current workflows with the Money Map, find revenue leaks, excess costs and process inefficiencies, assess vendor and tool consolidation, and advise on automation and digital or AI strategy. Larger, hands-on initiatives are scoped separately as fixed-fee projects.

If your cost analysis has surfaced questions you cannot answer from the ledger alone, see how Your Digital & AI Office works.
FAQ
What is a cost structure analysis in simple terms?
It is a review of everything your business spends, sorted by how each cost behaves (fixed or variable) and what it supports (direct or indirect). You then calculate each category’s share of total cost. The result shows how exposed your profit is to changes in sales and where cost reduction effort should focus.
How do you calculate cost structure percentages?
Add all fixed costs and all variable costs to get total cost. Divide each category by the total and multiply by 100. For example, $710,000 of fixed costs in a $1,000,000 total gives a fixed share of 71%. Repeat the calculation for each period so you can see how the mix shifts.
What belongs in an overhead cost breakdown?
Overhead covers indirect costs that support the whole business: rent, insurance, administrative salaries, utilities, office supplies, marketing, software, legal and professional fees and maintenance. Group them into pools, split fixed from variable, and allocate each pool to products or customers with a measurable base such as labor hours.
How long a period should the analysis cover?
Use enough history to capture normal monthly, seasonal and annual variation, which for most businesses means a full 12 months. A shorter window can mislead if your sales or costs follow a seasonal pattern.
How do you cut costs without hurting the business?
Target waste and duplication, not capability. Consolidate purchasing, renegotiate with vendors you keep, remove overlapping tools and fix manual processes. Check each proposed cut against customer satisfaction, product quality and safety before you act.
Sources
Management Accounting and Control lecture 3, MIT OpenCourseWare
Controlling Costs, My Own Business Institute, Santa Clara University
How to calculate your net cost per sale, American Family Insurance
Cost Analysis Standards and Guidelines, U.S. Department of Education
5 expert tips on executing an effective spend analysis, Ramp